


Table of contents
Some say that "you cannot observe without monitoring". Of course, you can also go into production without monitoring in place, but it will make your life extremely complicated if you must find a problem. Considering that everything around us is running by software applications, and competition is remarkably high in every sector, we cannot allow our applications to underperform or have unresolved issues because we may have very high-cost consequences. All systems fail, and every software has bugs. Given that application performance monitoring is a crucial part of our development time, we should aim to have a solution that mitigates issues before they become problems and let us face them. No one wants to wake up in the middle of the night because of some unexpected situation you could find out by looking at your application during the development phases. Selecting the right tool is essential for your business. Bugs are expensive, and quickly finding them will save you a lot of time, money, and mental health. We all have been in a situation where we jump from one log to another trying to put all the pieces together, and we all know that it is not funny when you have a production bug and your customers are facing some disruptions.
What should we look for?
Before shopping around, I have heavily used what AWS offers to us. It was important because all the products have their strengths and weaknesses. I had to understand the limitations and the needs of my application to be successful. For me, the significant points are:
- Alert system
- Reports
- User Experience
- End-to-end tracing with multiple accounts/teams
- Search
- Service Maps
AWS Observability offers multiple services around Amazon CloudWatch, X-Ray and CloudWatch Insights:
- Logging (why): By default, it is not centralised, and you have many log groups. CloudWatch Logs Insights enables you to search and analyse your log data interactively up to 20 log groups. Metrics (what): Several services provide free metrics for resources by default. Amazon CloudWatch can display all the services metrics of your account.
- Tracing (where): Distributed tracing with X-Ray helps you determine where the failures are. Moreover, they give you excellent visibility of performances.
- Insights: Collects and aggregates Lambda function runtime performance metrics and logs for your serverless applications.
You have everything you need in theory, but you must actively enable tracing (AWS X-Ray), Lambda Insights. For example, if you want to see a connection between your Lambda and a service like SQS, you manually instrument the code to do so. Let's take a simple case:
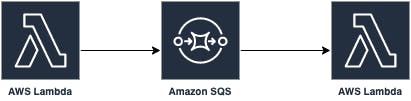
The X-Ray will show you two traces like this:
Without connecting them, and so at debug level, you cannot follow a single request. Because of this, you won't know which request is causing a problem.
Epsagon
Epsagon stitches together metrics, logs and traces, increasing observability, and is almost painless.
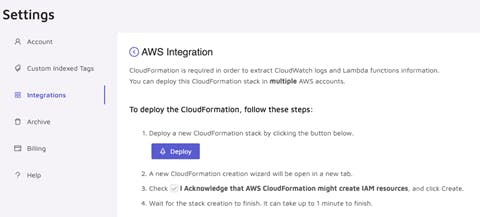
The onboarding is straightforward. You must deploy Epsagon CloudFormation into your AWS account by clicking one button.
Once your account is integrated, you can auto-trace your Lambda functions, but I would not use this choice because, with CI/CD, you want to be on top of your integration. So in a few steps, you are ready to go.
With CloudFormation, you can configure your Lambda functions like this:
Globals:
  Function:
    Runtime: nodejs14.x
    Environment:
      Variables:
        AWS_NODEJS_CONNECTION_REUSE_ENABLED: 1
        EPSAGON_TOKEN: xxxxxxx
        EPSAGON_DEBUG: false
    Layers:
      - "arn:aws:lambda:eu-central-1:066549572091:layer:epsagon-node-layer:315"
In the Lambda code, you need only to initialise the library and wrap your function:
import epsagon from "epsagon";
import DynamoDB from "aws-sdk/clients/dynamodb";
import { MyQuery } from "./query/myQuery";

epsagon.init({
  token: process.env.EPSAGON_TOKEN,
  appName: `ApplicationName`,
  labels: [["service", "xxx"]],
  metadataOnly: false,
});

const dynamoDbClient = new DynamoDB.DocumentClient();
const myQuery = new MyQuery();

export const startExecution: any = epsagon.lambdaWrapper(async (event: SQSEvent): Promise<void> => {
   // do something
});
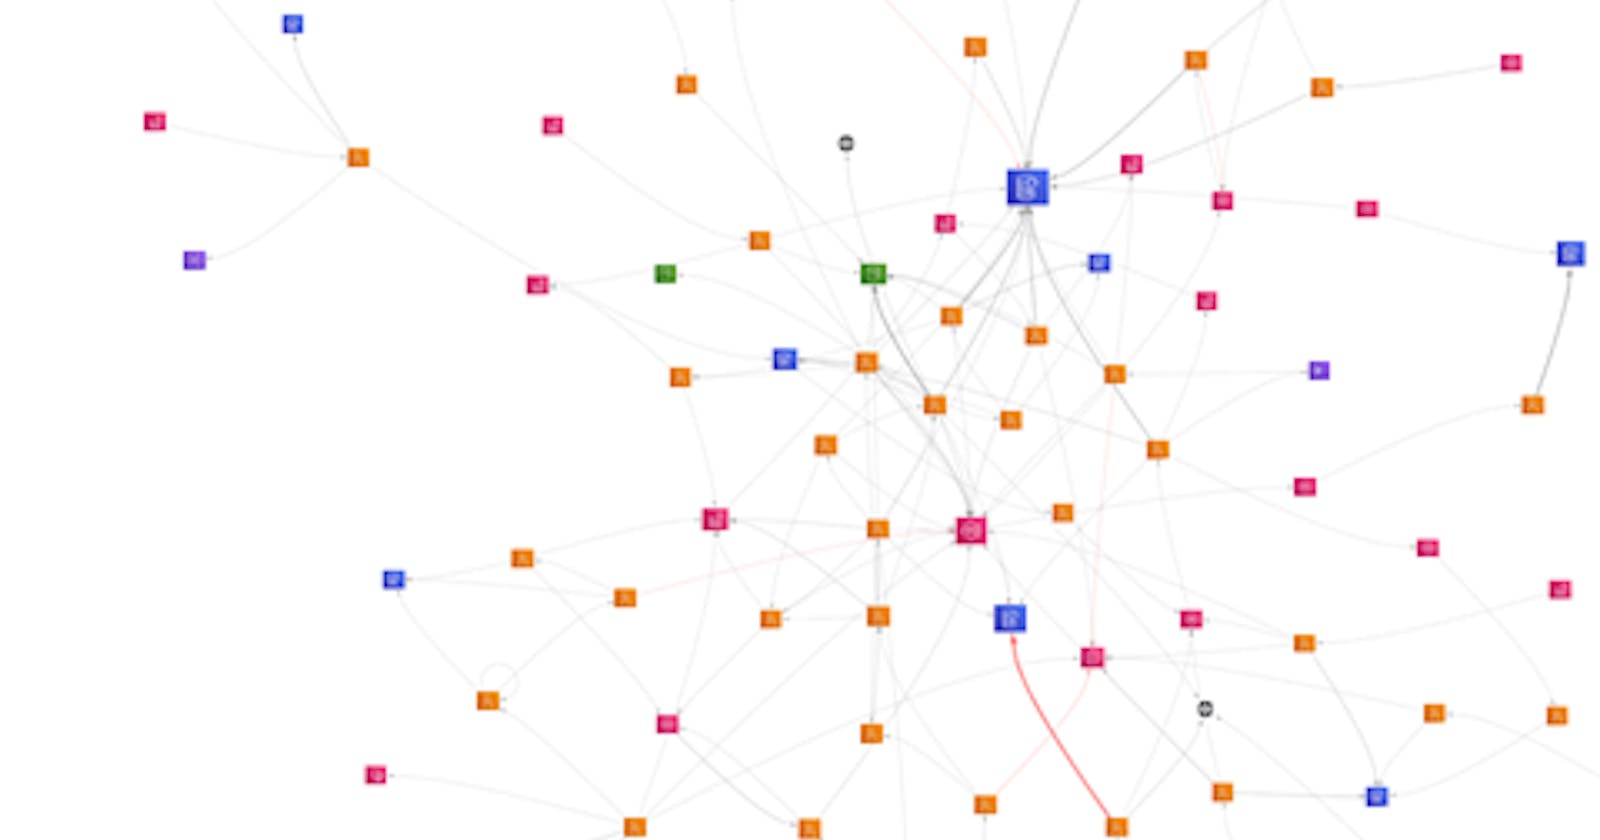
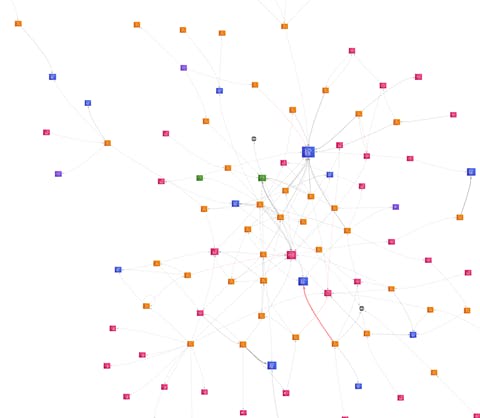
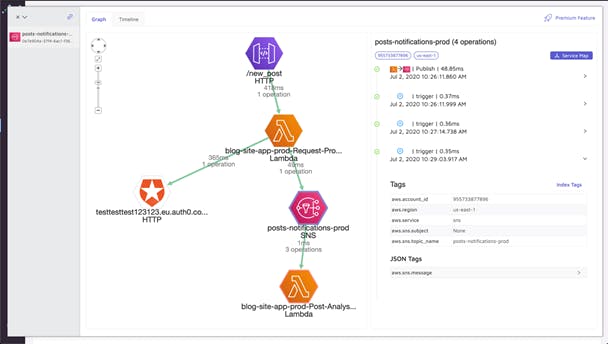
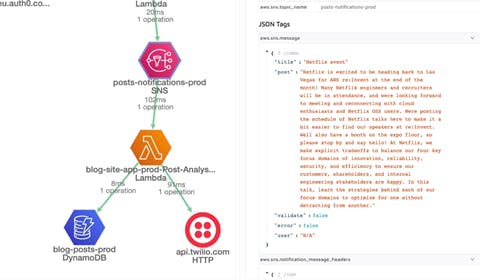
Suppose you are now using SQS, SNS, EventBridge etc. In that case, Epsagon will trace them automatically for you without you adding instrumentation for each service, and you will end up with a Service Map that will connect all your services like this:
Service Map is not helpful if you cannot search or filter. Something convenient in Epsagon is the concept of tagging traces. Tagging traces can help you enrich the data collected as part of the trace for two main reasons:
- To pinpoint a specific event in our application.
- To detect trends based on a unique business dimension.
Tagging adds more context to an existing trace. You can do it in two ways, and it depends on what you want to achieve:
- By code "epsagon.label(''key'', ''value'')"".
- Indexing custom tags from your trace.
Now you can search traces and filter by your custom tags if you need. The message's payload that triggers the Lambda function is something you are not getting with AWS X-RAY, but I have found it extremely useful.
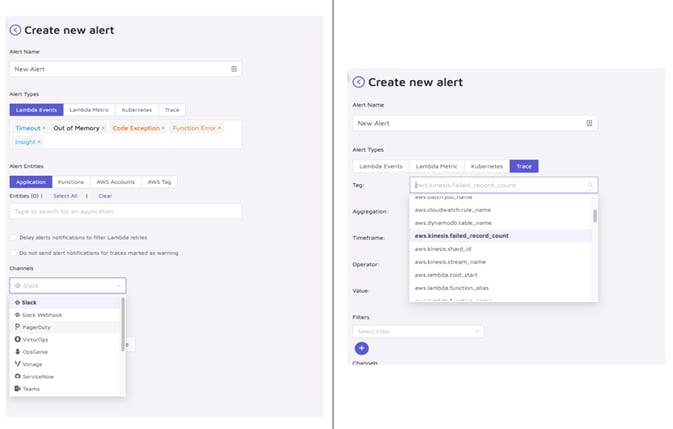
Finally, I would like to spend some words on the Alert system. Compared to AWS options, it is much easier, plus you have better options out of the box like visibility on timeout, and you get alerts if your Lambda is close to reaching the configured setting like Memory.
Note
Epsagon is now part of Cisco and FREE for everyone under the 10M trace, which is a lot for many. If you are over this limit, I think you need to look for alternatives, and there are many of them out there. A good one is Lumigo.
Conclusion
I like Epsagon. However, as I already mentioned, every solution out there has its strength and weakness. Thanks to the enhanced observability, I can now find issues earlier before becoming a problem. All the services are very similar, but only a few do not require a code change. For example, writing code to instrument the tool, writing uni tests is not where you want to go.